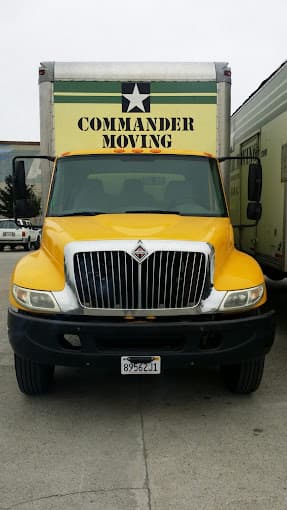
Commander Moving Inc

3668 Enterprise Ave, Hayward, CA 94545, USA

DOT 2806349

Commander Moving has been delivering excellence in relocation since 2011. You can read all about their quality services in over seven hundred reviews you can find online. That's a lot of moves completed, and a lot of people that are sitting down to rave about this team. One could say their service is even movie-star famous. Catch them in the Blindspotting movie and TV show. Fully licensed and insured, the Commander crew makes moving fun. There are many instances in which this company can provide some very useful assistance. You'll see some of them listed below, but rest assured that these are only examples. If you can't find what you need, call Commander Moving, and you'll see how quick they are at providing a solution. If you're making a major change from a one-bedroom apartment into a three-bedroom house, this team can help. If you're moving your office, store, or warehouse, they can do that, too. Don't hesitate to call if you're moving across the street, the city, or to the next state over. They can also offer short or long-term storage at their facility and exceptional packing services. Commander Moving is your affordable, experienced, and trusted choice in California.
Company Image

Office location

3668 Enterprise Avenue, Hayward, CA, USA

Company avatar

FMCSA Company Profile

Years in Business: 9 years (First Registered in Sep. 2015)

Last Report Filed: Less than 1 year ago ago

Company Information

Legal Name
commander moving inc
DOT Number
2806349
Entity Type
Carrier

Company Officers

Officer 1
karel smid

Cargo Types

General Freight
Household Goods

Safety Information

Detailed safety guidelines and procedures to ensure compliance and minimize risks.

Performance measures

High-level performance indicators to quickly assess the company's scale.

Unsafe driving
Total Violations
Driver hours of service
No OOS Violations
OOS Violations
Driver Fitness
Vehicle Maintenance
What does this mean?
The chart highlights five key safety measures used to assess and improve operational safety in transportation.
Total Violations: The total number of violations recorded, including both Out of Service (OOS) and non-OOS violations.
Out of Service (OOS) Violations: Violations serious enough to temporarily prohibit a driver or vehicle from operating until the condition is corrected.
Non-OOS Violations: Violations that are documented but do not require immediate cessation of operations.
Driver Fitness: Violations related to driver qualifications, including medical certificates, CDL requirements, and proper documentation.
Unsafe Driving: Operating violations such as speeding, improper lane changes, and failure to obey traffic control devices.
Hours of Service: Violations of driving time limitations and required rest periods to prevent driver fatigue.
Vehicle Maintenance: Violations related to vehicle condition, including brakes, lights, cargo securement, and other mechanical issues.

Crash Rate

0

Based on recordable crashes per vehicle
100% Lower

than national average.

Key Metrics

High-level performance indicators to quickly assess the company's scale and activity.

Annual Miles (2023)

100,000

Filled:
02/10/2024

Driver Satistics

5

Total Drivers

0

CDL (N/A)

Fleet Size:
B
- 2-3

3

Trucks

3

Power Units

Drivers

Overview of vehicle assets and their allocation for operational needs.

Driver Distribution

Overview of driver allocation for interstate and intrastate routes, helping identify resource distribution.

In-State:
5

Distance Breakdown

Analysis of trip distances categorized by interstate (cross-State) and intrastate (in-State) operations to optimize planning.

Fleet

Essential insights into the composition and reach of the driver workforce.

Fleet Information

Fleet Size: B

Breakdown of fleet composition, including owned and leased vehicles, to assess operational capacity.

Inspections

Report #
State
Date↓
Driver Violations
Vehicle Violations
Unsafe Driving
Driver Fatigue
Substances/Alcohol
Vehicle Maint.
NDLU003725CA2022-04-28000000
UCZC001209CA2022-04-18000000
NBH6000250CA2019-07-17000000
NDKR000049CA2019-05-24000001
1866101011CA2019-02-09000001

Inspections per year

Inspections per 100K miles (2023)

5

Total Inspections

5

Safety Inspection Results

Failed Safety Inspections

0

5% Lower

than national average.

Driver-Related Safety Failures

0

5% Lower

than national average.

Vehicle-Related Safety Failures

0

4% Lower

than national average.

Inspection Map
Visualization of inspection data across the United States.

Violations

Insp DateCategorySevere FailureViolation Details

Violations per 100K miles

2

100% Lower

than national average.

Total Violations

2

84% Lower

than national average.

Crashes

REPORT #
DATE↓
STATE
FATALITIES
INJURIES
TOW AWAY
LICENSE NUMBER
CA370190043001-FEB-19CA01Y89562J1

Amount of Crashes

1

Injury Crashes
1

Fatalities

0

Injuries

1

Injury Rate:
10.00

Number of Tows

1

Tow Rate:
100.0%
Number of fatalities per year
Number of injuries per year

Incidents by season

Incidents by weather condition

Incidents by road surface condition

Incidents by light condition

Crash Map
Visualization of crashes data across the United States.