Joshua's Moving Packing & Storage, LLC

350 Demeter St, East Palo Alto, CA 94303-1305, United States, East Palo Alto, CA, United States, California

DOT number: 3184868

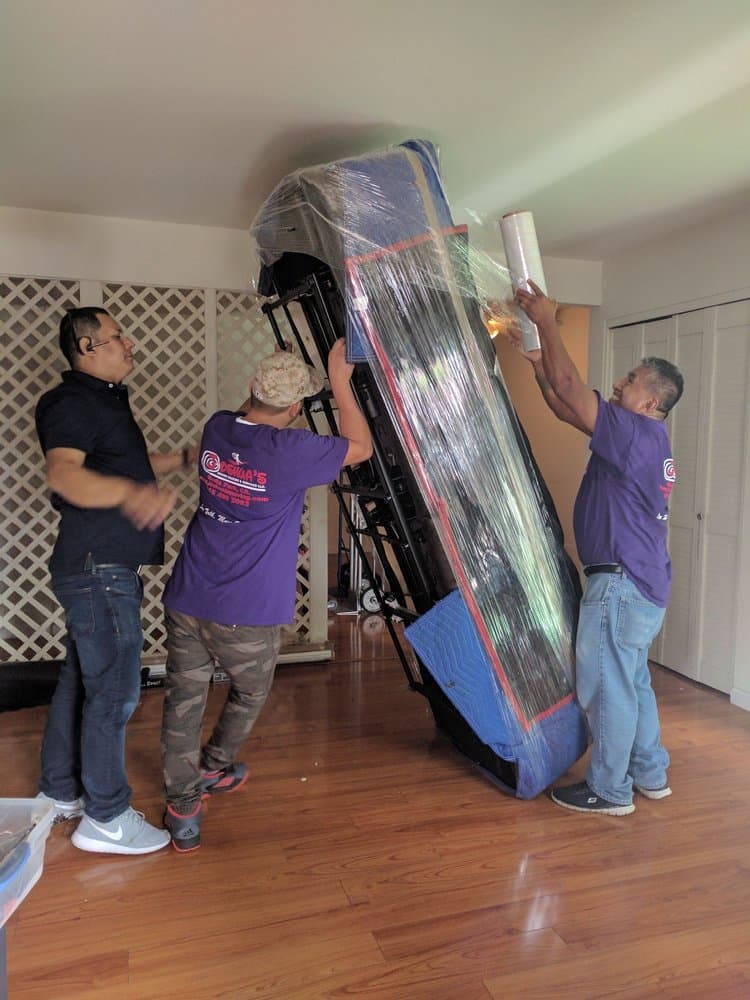
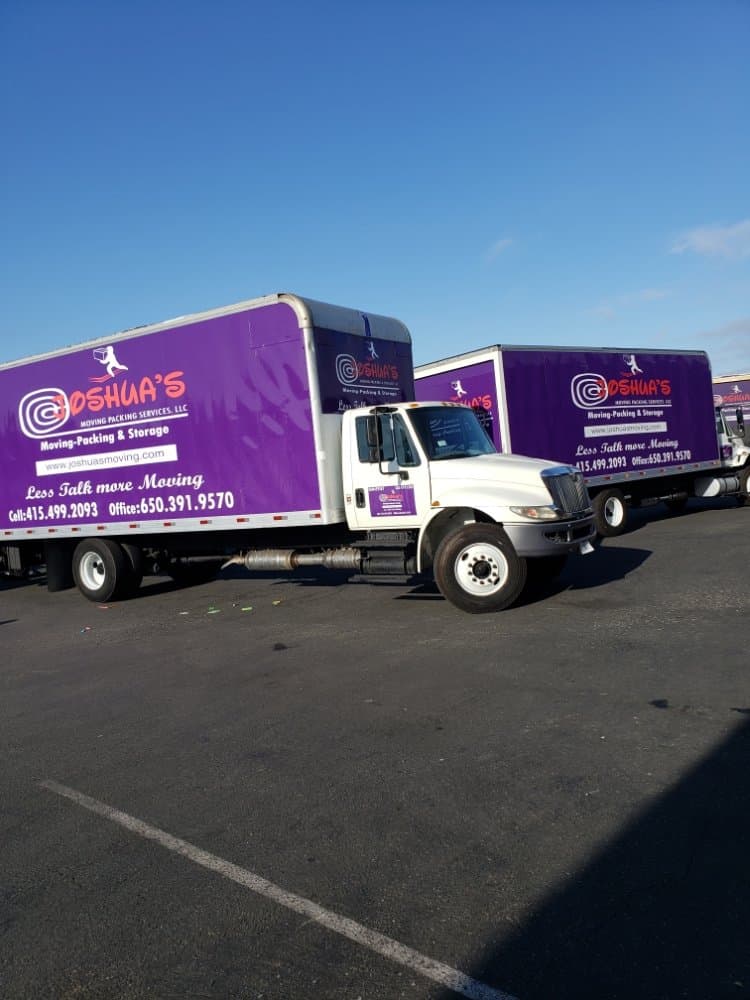
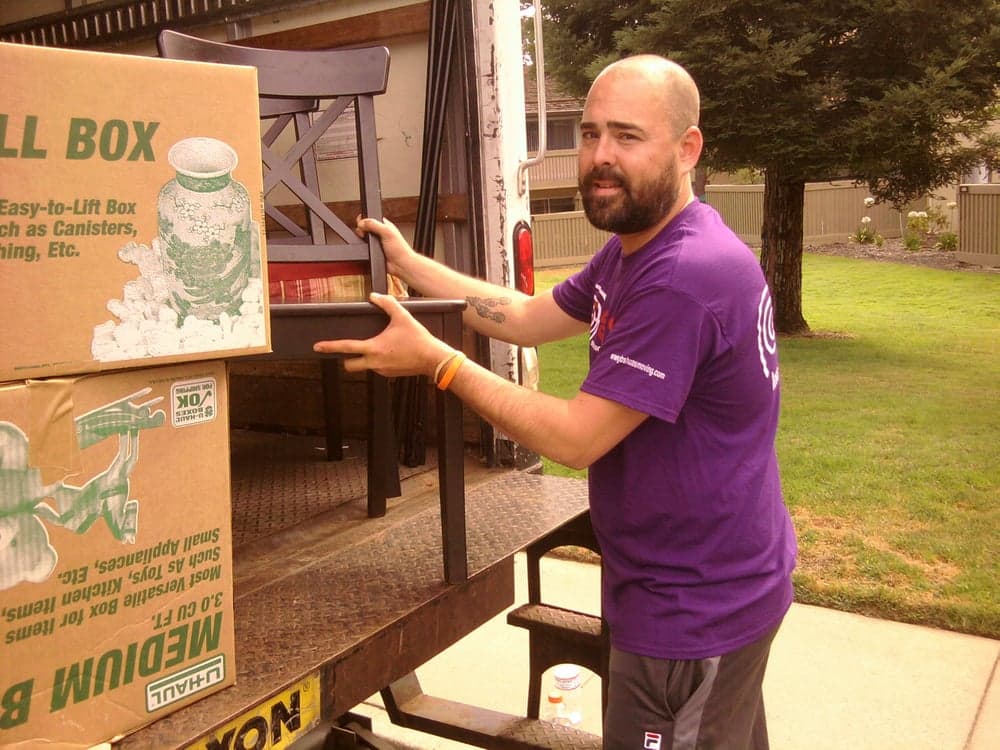
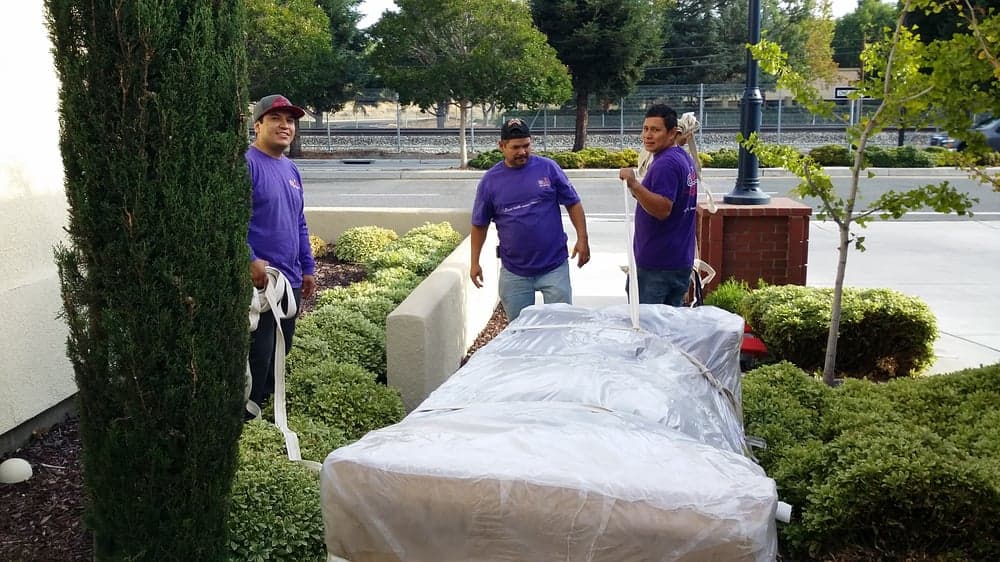
For any and all moves in the Bay Area, Joshua's Moving, Packing, & Storage is the clear choice. Not only because this company is as experienced as it can be but also because it's full-service. This means that its team can handle every step in your journey from start to finish. This kind and courteous crew is happy to take most stuff off your plate to keep your stress levels down. So, if your goal is to have a smooth, easy, non-overwhelming move, you know what the best option is. Neither rain, sleet, fog, or shine will face these movers. They are local and used to the Bay Area's weather. In fact, they are so good at what they do that they boast a 4.8 score on their Google profile. People love them and how they work. It's as simple as that. From one-bedroom apartments to entire offices, no job is too big or small. To save you time and energy, they will handle the packing. As a bonus, this ensures your belongings are safe the whole way through. They also provide junk removal, storage, and staging services. Joshua's Moving, Packing, & Storage promises a moving day like no other.
Company Image
Company avatar

Company Profile

Years in Business: 6 years

Last Update: 1 year

Company Information

Legal Name
joshua's moving packing services llc
DOT Number
3184868
Entity Type
Carrier

Company Officers

Officer 1
carlos rengifo

Filing Information

MSC-150 Date
06/11/2023
Added Date
07/09/2018

Cargo Types

Household Goods

Safety Information

Detailed safety guidelines and procedures to ensure compliance and minimize risks.

Performance measures

High-level performance indicators to quickly assess the company's scale.

Unsafe driving
Total Violations
Driver hours of service
No OOS Violations
OOS Violations
Driver Fitness
Vehicle Maintenance
What does this mean?
The chart highlights five key safety measures used to assess and improve operational safety in transportation.
Total Violations: The total number of violations recorded, including both Out of Service (OOS) and non-OOS violations.
Out of Service (OOS) Violations: Violations serious enough to temporarily prohibit a driver or vehicle from operating until the condition is corrected.
Non-OOS Violations: Violations that are documented but do not require immediate cessation of operations.
Driver Fitness: Violations related to driver qualifications, including medical certificates, CDL requirements, and proper documentation.
Unsafe Driving: Operating violations such as speeding, improper lane changes, and failure to obey traffic control devices.
Hours of Service: Violations of driving time limitations and required rest periods to prevent driver fatigue.
Vehicle Maintenance: Violations related to vehicle condition, including brakes, lights, cargo securement, and other mechanical issues.

Crash Rate

0

Based on recordable crashes per vehicle
100% Lower

than national average.

Key Metrics

High-level performance indicators to quickly assess the company's scale and activity.

Annual Miles (2022)

250,000

Filled:
06/11/2023

Driver Satistics

7

Total Drivers

7

CDL (100.0%)

Fleet Size:
C
- 4-6

5

Trucks

5

Power Units

Drivers

Overview of vehicle assets and their allocation for operational needs.

Driver Distribution

Overview of driver allocation for interstate and intrastate routes, helping identify resource distribution.

Intrastate:
7
Intrastate100%

Distance Breakdown

Analysis of trip distances categorized by interstate (cross-State) and intrastate (in-State) operations to optimize planning.

Fleet

Essential insights into the composition and reach of the driver workforce.

Fleet Information

Fleet Size: C

Breakdown of fleet composition, including owned and leased vehicles, to assess operational capacity.

Inspections

Report #
State
Date↓
Driver Violations
Vehicle Violations
Unsafe Driving
Driver Fatigue
Substances/Alcohol
Vehicle Maint.
UBZU003055CA2023-10-02000000
NBGW003980CA2022-09-23000000
N8AH002988CA2021-11-15000000
NCPN002123CA2021-07-22000000
N5S0003976CA2021-05-06000000
6210018020NV2021-03-08000000
N9VP001769CA2020-07-07000000
NB72000283CA2019-07-23000000

Inspections per year

Inspections per 100K miles (2022)

3

Total Inspections

8

Safety Inspection Results

Failed Safety Inspections

0

5% Lower

than national average.

Driver-Related Safety Failures

0

5% Lower

than national average.

Vehicle-Related Safety Failures

0

4% Lower

than national average.

Inspection Map
Visualization of inspection data across the United States.

Violations

Insp DateCategorySevere FailureViolation Details

Violations per 100K miles

1

100% Lower

than national average.

Total Violations

3

76% Lower

than national average.